
(NASDAQ: PYPL)
Q3 2023 Results
1
• Q3'23: Solid third quarter performance delivering on both revenue and EPS
◦ Total payment volume (TPV) of $387.7 billion, growing 15% and 13% on an FX-neutral (FXN) basis
◦ Net revenues of $7.4 billion, growing 8% and 9% FXN
◦ GAAP operating income of $1.2 billion, growing 4%; non-GAAP operating income of $1.6 billion,
growing 8%
◦ GAAP EPS of $0.93 compared to $1.15 in Q3'22; non-GAAP EPS of $1.30 compared to $1.08 in
Q3'22, growing 20%
◦ Operating cash flow of $1.3billion
1
with free cash flow of $1.1billion
1
• FY'23: Ongoing operating discipline driving earnings growth
◦ Q4'23 net revenues expected to grow ~6%-7% on a spot basis and ~7%-8% FXN
◦ Q4'23 GAAP EPS expected to be ~$1.20; non-GAAP EPS expected to grow ~10% to ~$1.36
◦ FY'23 GAAP EPS now expected to be ~$3.75 compared to $2.09 in FY'22; non-GAAP EPS
now expected to grow ~21% to ~$4.98
◦ FY'23 share repurchases expected to reach ~$5 billion
• Appointing Jamie Miller Chief Financial Officer (CFO), effective November 6
◦ Jamie is an accomplished CFO with decades of experience in both senior finance and
operations roles, guiding companies through dynamic environments and meaningful
transformation, including GE and Cargill, and was most recently CFO of EY
Q3'23 Highlights
For a reconciliation of non-GAAP financial measures to the most directly comparable GAAP financial measures, please see the
section titled “Non-GAAP Measures of Financial Performance” and the subsequent tables at the end of this press release.
1. Q3'23 includes a ~$0.8 billion negative impact from European buy now, pay later (BNPL) loans originated as held for sale (HFS).
2. On an FXN basis.
Third Quarter 2023 Results
San Jose, California
November1, 2023
Alex Chriss
President and CEO
GAAP Non-GAAP
USD $
YoY
Change
USD $
YoY
Change
Net
Revenues
$7.4B 8% $7.4B 9%
2
Operating
Income
$1.2B 4% $1.6B 8%
EPS $0.93 (19%) $1.30 20%
“My first 30 days leading PayPal
have confirmed my belief in the
company's strong assets and
market position. Now, we must
harness these strengths and put
the weight of the organization
behind our most important
priorities.
In the process, we will become
more efficient so we can innovate
and execute with higher velocity.
The opportunity to drive greater
impact for our customers and
unlock profitable growth makes it
an exciting time to be at PayPal."
Q3 2023 Results
2
Financial Highlights
Net revenues increased 8% and 9% FXN
• Net revenues of $7.4 billion, growing 8% and 9% FXN
• GAAP operating income of $1.2 billion, growing 4%; non-GAAP
operating income of $1.6 billion, growing 8%
• GAAP operating margin of 15.7%, declining 59 basis points; non-GAAP
operating margin of 22.2%, declining 18 basis points
• GAAP EPS of $0.93, compared to $1.15 in Q3'22; non-GAAP EPS of
$1.30, compared to $1.08 in Q3'22
◦ GAAP EPS includes a positive impact of ~$0.02 from PayPal’s strategic
investment portfolio, compared to a positive impact of ~$0.34 in Q3'22
$1.1B
$1.2B
Q3'22
Q3'23
Key Operating and Financial Metrics
1. For a reconciliation of non-GAAP financial measures to the most directly comparable GAAP financial measures, please see the section
titled “Non-GAAP Measures of Financial Performance” and the subsequent tables at the end of this press release.
“PayPal delivered solid third
quarter results, with currency-
neutral revenue growth and
EPS ahead of our expectations.
Our performance
demonstrates disciplined
expense management and
capital allocation. We are
focused on accelerating our
profitable growth."
$1.5B
$1.6B
Q3'22
Q3'23
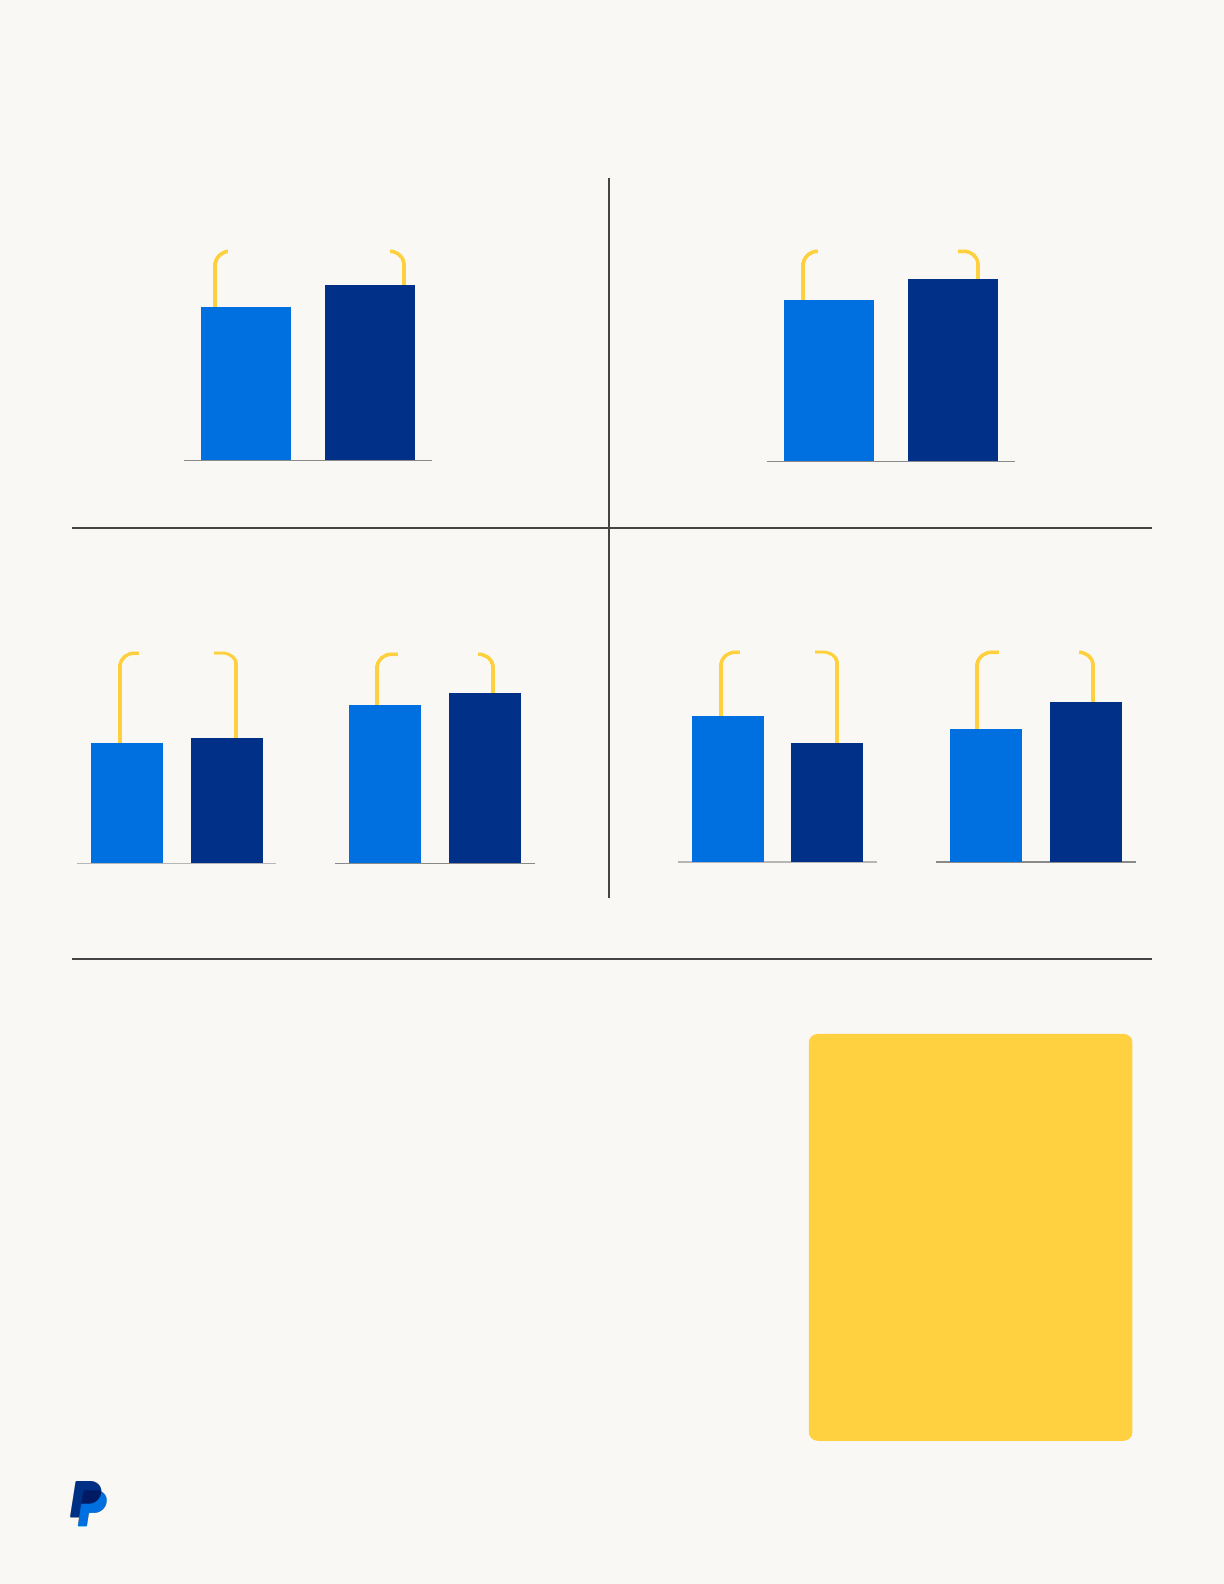
+8%
$337.0B
$387.7B
Q3'22
Q3'23
+15% | +13%
$6.8B
$7.4B
Q3'22
Q3'23
+8% | +9%
Gabrielle Rabinovitch
SVP, Acting CFO
+4%
Operating Income
Total Payment Volume Net Revenues
FXNSpot
FXNSpot
Non-GAAP
1
GAAP
$1.15
$0.93
Q3'22
Q3'23
$1.08
$1.30
Q3'22
Q3'23
+20%
(19%)
EPS
Non-GAAP
1
GAAP

Q3 2023 Results
3
Balance Sheet and Liquidity
Strong balance sheet and continued commitment to capital return
• Cash, cash equivalents, and investments totaled $15.4 billion as of September30, 2023
• Debt totaled $10.6billion as of September30, 2023
• In Q3'23, repurchased approximately 23 million shares of common stock, returning $1.4 billion
to stockholders
◦ On a trailing twelve month basis, repurchased approximately 75 million shares of common
stock, returning $5.4 billion to stockholders
Operating Highlights
Double digit volume and transaction growth year over year
• $387.7 billion in TPV, growing 15% and 13% FXN
• 6.3 billion payment transactions, up 11%
• 56.6 payment transactions per active account on a trailing twelve month basis, up 13%
• 428 million total active accounts, compared to 432 million in Q3'22
Nikisha Bailey and Matt Nam founded Win Win
Coffee to build community around coffee that’s
ethically and sustainably sourced.
After winning funding from PayPal’s Community
Impact partners – Black Girl Ventures and the New
York Urban League – Nikisha and Matt were able to
signifcantly grow and evolve their business. Now,
they are leveraging PayPal Checkout online and
Venmo QR codes at their pop-ups to drive sales.
Up next, Win Win plans to launch an online coffee
marketplace powered by PayPal and Braintree that
will bridge the gap by connecting growers directly
with buyers – spreading the joy of incredible coffee
and creating equity across the coffee diaspora.
Win Win Coffee
“We started Win Win Coffee to
make a positive impact on the
world – both for coffee lovers and
coffee growers – and PayPal has
been there throughout our journey.
We’ve used PayPal products online
and in-person to increase our sales,
and also participated in PayPal
community events that gave us the
opportunity to consult with
employees on how to scale and
grow our business.”
Nikisha Bailey & Matt Nam
Co-founders, Win Win Coffee

Q3 2023 Results
4
Q3 2023 Results 4
$1.6B
$1.1B
$0.8B
$1.9B
Free
cash flow
Free
cash flow
Adjustment
for HFS
impact
Adjusted
free cash
flow
$1.8B
$2.1B
($0.8B)
$1.3B
Operating
cash flow
Net
inflows
HFS
impact
Operating
cash flow
Q3'22
Q3'23
Q3'22
Q3'23
Operating Cash Flow
2,3
Free Cash Flow / Adjusted Free Cash Flow
1,2,3,4
1. For a reconciliation of non-GAAP financial measures to the most directly comparable GAAP financial measures, please see the section titled “Non-GAAP Measures of Financial Performance”
and the subsequent tables at the end of this press release. 2. Reflects the impact of reclassification as described in our earnings press release dated February 9, 2023. 3. Q3'23 includes a ~$0.8
billion negative impact from European BNPL loans originated as HFS. Figures may not sum due to rounding. 4. See page 18 of this press release for a reconciliation of operating cash flow to
free cash flow and adjusted free cash flow.
Cash Flow
• In Q3'23, generated cash flow from operations of $1.3 billion, and free cash flow of $1.1 billion
◦ Cash flow from operations and free cash flow include a $0.8 billion negative impact from European buy now,
pay later (BNPL) loans originated as held for sale (HFS) in the quarter
◦ Excluding the impact of BNPL loans originated as HFS, adjusted free cash flow of $1.9 billion in Q3'23 and $3.8
billion year-to-date
• In June 2023, PayPal entered into a multi-year agreement with KKR to sell up to €40 billion of eligible consumer
installment receivables. In October 2023, PayPal began selling those receivables and as of October 31, 2023,
approximately $1.4 billion of such receivables, which were classified as held for sale, have been sold

Q3 2023 Results
5
Presented in millions, except per share data and
percentages
Q3 2023 Q3 2022 YoY Growth
FXN
YoY Growth
Total payment volume (TPV) $387,701 $336,973 $50,728 15% 13%
GAAP
Net revenues $7,418 $6,846 $572 8% N/A
Operating margin 15.7% 16.3% ** (59bps) N/A
Effective tax rate 17.8% 15.7% ** 2.1pts N/A
Net income (loss) $1,020 $1,330 ($310) (23%) N/A
Earnings
per diluted share
$0.93 $1.15 ($0.22) (19%) N/A
Net cash provided by
operating activities
1,2
$1,259 $1,755 ($496) (28%) N/A
Non-GAAP
Net revenues $7,418 $6,846 $572 8% 9%
Operating margin 22.2% 22.4% ** (18bps) N/A
Effective tax rate 15.9% 16.2% ** (0.4pts) N/A
Net income $1,427 $1,254 $173 14% N/A
Earnings
per diluted share
$1.30 $1.08 $0.22 20% N/A
Free cash flow
1,2
$1,101 $1,573 ($472) (30%) N/A
Q3'23 Financial and
Operating Highlights
1. Reflects the impact of reclassification as described in our earnings press release dated February 9, 2023.
2. Q3'23 includes a ~$0.8 billion negative impact from European BNPL loans originated as HFS.
** Not meaningful

Q3 2023 Results
6
Financial Guidance
Q4'23 Guidance
• Net revenues expected to grow ~6%-7% on a spot basis and ~7%-8% FXN
• GAAP earnings per diluted share expected to be ~$1.20, compared to $0.81 in the prior year period,
and non-GAAP earnings per diluted share expected to grow ~10% to $1.36, compared to $1.24 in the
prior year period
◦ In the fourth quarter of 2022, GAAP EPS included a negative impact of approximately $0.11 on PayPal’s
strategic investment portfolio
◦ Estimated non-GAAP amounts for the three months ending December 31, 2023 reflect adjustments of
approximately $150 million, including estimated stock-based compensation expense and related payroll taxes
of approximately $400 million and an estimated pre-tax gain of approximately $329 million related to the sale
of Happy Returns
FY'23 Guidance
• GAAP earnings per diluted share now expected to be ~$3.75, compared to $2.09 in FY’22; non-GAAP
earnings per diluted share now expected to grow ~21% to ~$4.98, compared to $4.13 in FY’22
◦ In 2022, GAAP EPS included a negative impact of approximately $0.20 on PayPal’s strategic investment
portfolio
◦ Estimated non-GAAP amounts for the twelve months ending December 31, 2023 reflect adjustments of
approximately $1.7 billion, including estimated stock-based compensation expense and related payroll taxes
of approximately $1.6 billion, an estimated pre-tax gain of approximately $329 million related to the sale of
Happy Returns in Q4'23, and a restructuring charge of approximately $117 million that occurred in Q1'23
Conference Call & Webcast
PayPal Holdings, Inc. will host a conference call to discuss third quarter 2023 results at 2:00 p.m. Pacific Time
today. A live webcast of the conference call, together with a slide presentation that includes supplemental
financial information and reconciliations of certain non-GAAP measures to their most directly comparable GAAP
measures, can be accessed through the company’s Investor Relations website at https://investor.pypl.com. In
addition, an archive of the webcast will be accessible for 90 days through the same link.
Please see “Non-GAAP Financial Measures” and “Non-GAAP Measures of Financial Performance”
for important additional information.

Q3 2023 Results
7
Presentation
All growth rates represent year-over-year comparisons, except as otherwise noted.
FXN results are calculated by translating the current period local currency results by the
prior period exchange rate. FXN growth rates are calculated by comparing the current
period FXN results with the prior period results, excluding the impact from hedging
activities. All amounts in tables are presented in U.S. dollars, rounded to the nearest
millions, except as otherwise noted. As a result, certain amounts and rates may not sum or
recalculate using the rounded dollar amounts provided.
This press release includes financial measures defined as “non-GAAP financial measures”
by the Securities and Exchange Commission ("SEC") including: non-GAAP net income, non-
GAAP earnings per diluted share, non-GAAP operating income, non-GAAP operating
margin, non-GAAP effective tax rate, free cash flow and adjusted free cash flow. For an
explanation of the foregoing non-GAAP measures, please see “Non-GAAP Measures of
Financial Performance” included in this press release. These measures may be different
from non-GAAP financial measures used by other companies. The presentation of this
financial information, which is not prepared under any comprehensive set of accounting
rules or principles, is not intended to be considered in isolation of, or as a substitute for, the
financial information prepared and presented in accordance with generally accepted
accounting principles (GAAP). For a reconciliation of these non-GAAP financial measures to
the most directly comparable GAAP measures, see “Non-GAAP Measures of Financial
Performance,” “Reconciliation of GAAP Operating Income to Non-GAAP Operating Income
and GAAP Operating Margin to Non-GAAP Operating Margin,” “Reconciliation of GAAP Net
Income (Loss) to Non-GAAP Net Income, GAAP Diluted EPS to Non-GAAP Diluted EPS, and
GAAP Effective Tax Rate to Non-GAAP Effective Tax Rate,” and “Reconciliation of Operating
Cash Flow to Free Cash Flow and Adjusted Free Cash Flow".
Non-GAAP Financial Measures

Q3 2023 Results
8
Forward-Looking Statements
This press release contains forward-looking statements relating to, among other things, the future results of
operations, financial condition, expectations, and plans of PayPal Holdings, Inc. and its consolidated
subsidiaries ("PayPal") that reflect current projections and forecasts. Forward-looking statements can
be identified by words such as “may,” “will,” “would,” “should,” “could,” “expect,” “anticipate,” “believe,”
“estimate,” “intend,” "continue," “strategy,” “future,” “opportunity,” “plan,” “project,” “forecast,” and other
similar expressions. Forward-looking statements may include, but are not limited to, statements regarding
our guidance and projected financial results for fourth quarter and full year 2023; our capital return program;
the impact and timing of product launches and acquisitions; and the projected future growth of PayPal’s
businesses. Forward-looking statements are based upon various estimates and assumptions, as well as
information known to PayPal as of the date of this press release, and are inherently subject to numerous risks
and uncertainties. Our actual results could differ materially from those estimated or implied by forward-
looking statements. Factors that could cause or contribute to such differences include, but are not limited to:
our ability to compete in markets that are highly competitive and subject to rapid technological change, and
to develop and deliver new or enhanced products and services on a timely basis; cyberattacks and security
vulnerabilities, and associated impacts; the effect of global and regional political, economic, market and
trade conditions, including military conflicts, supply chain issues and related events that affect payments or
commerce activity, including inflation and rising interest rates; the impact of catastrophic events, such as
global pandemics, that may disrupt our business, as well as our customers, suppliers, vendors and other
business partners; the stability, security and performance of our payments platform; the effect of extensive
government regulation and oversight related to our business, products and services in a variety of areas,
including, but not limited to, laws covering payments, lending and consumer protection; the impact of
complex and changing laws and regulations worldwide, including, but not limited to, laws covering privacy,
data protection, and cybersecurity; the impact of payment card, bank, or other network rules or practices;
risks related to our credit products, including customer default rates and the ability to realize benefits from
our agreements with third parties, such as our agreement to sell our European loan receivables; changes in
how consumers fund transactions; our ability to effectively detect and prevent the use of our services for
fraud, abusive behaviors, illegal activities, or improper purposes; our ability to manage regulatory and
litigation risks, and the outcome of legal and regulatory proceedings; our reliance on third parties in many
aspects of our business; damage to our reputation or brands; fluctuations in foreign currency exchange rates;
changes in tax rates and exposure to additional tax liabilities; changes to our capital allocation, management
of operating cash or incurrence of indebtedness; our ability to timely develop and upgrade our technology
systems, infrastructure and customer service capabilities; the impact of proposed or completed acquisitions,
divestitures, strategic investments, or entries into new businesses or markets; and our ability to attract, hire,
and retain highly talented employees. The forward-looking statements in this release do not include the
potential impact of any acquisitions or divestitures that may be announced and/or contemplated after the
date hereof. More information about factors that could adversely affect PayPal’s results of operations,
financial condition and prospects, or that could cause actual results to differ from those expressed or implied
in forward-looking statements is included under the captions “Risk Factors,” “Legal Proceedings” and
“Management’s Discussion and Analysis of Financial Condition and Results of Operations” in PayPal’s most
recent annual report on Form 10-K and its subsequent quarterly reports on Form 10-Q, copies of which may
be obtained by visiting PayPal’s Investor Relations website at https://investor.pypl.com or the SEC’s website
at www.sec.gov. All information in this release is as of November1, 2023. For the reasons discussed above,
you should not place undue reliance on the forward-looking statements in this press release. PayPal assumes
no obligation to update such forward-looking statements.

Q3 2023 Results
9
Disclosure Channels
PayPal Holdings, Inc. uses the following channels as means of disclosing information about the
company and for complying with its disclosure obligations under Regulation FD:
• Investor Relations website (https://investor.pypl.com)
• PayPal Newsroom (https://newsroom.paypal-corp.com/)
• PayPal Corporate website (https://about.pypl.com)
• LinkedIn page (https://www.linkedin.com/company/paypal)
• Facebook page (https://www.facebook.com/PayPalUSA/)
• YouTube channel (https://www.youtube.com/paypal)
• Alex Chriss' LinkedIn profile (https://www.linkedin.com/in/alexchriss/)
• Alex Chriss' X profile (https://twitter.com/acce)
• Gabrielle Rabinovitch's LinkedIn profile (https://www.linkedin.com/in/gabriellerabinovitch/)
The information that is posted through these channels may be deemed material.
Accordingly, investors should monitor these channels in addition to PayPal’s press releases,
filings with the SEC, public conference calls, and webcasts.
Investor Relations Contact
Media Relations Contact
© 2023 PayPal Holdings, Inc. All rights reserved. Other company and product names may be trademarks of their respective owners.

Q3 2023 Results
10
PayPal Holdings, Inc.
Unaudited Condensed Consolidated Balance Sheets
September 30,
2023
December 31,
2022
(Inmillions, except par value)
ASSETS
Current assets:
Cash and cash equivalents $ 6,816 $ 7,776
Short-term investments 4,731 3,092
Accounts receivable, net 988 963
Loans and interest receivable, held for sale 2,165 —
Loans and interest receivable, net 5,066 7,431
Funds receivable and customer accounts 34,641 36,264
Prepaid expenses and other current assets 2,228 1,898
Total current assets 56,635 57,424
Long-term investments 3,855 5,018
Property and equipment, net 1,529 1,730
Goodwill 10,935 11,209
Intangible assets, net 564 788
Other assets 2,922 2,455
Total assets $ 76,440 $ 78,624
LIABILITIES AND EQUITY
Current liabilities:
Accounts payable $ 131 $ 126
Funds payable and amounts due to customers 38,641 40,014
Accrued expenses and other current liabilities 3,533 4,055
Income taxes payable 1,137 813
Total current liabilities 43,442 45,008
Deferred tax liability and other long-term liabilities 2,618 2,925
Long-term debt 10,640 10,417
Total liabilities 56,700 58,350
Equity:
Common stock, $0.0001 par value; 4,000 shares authorized; 1,080 and 1,136 shares
outstanding as of September30, 2023 and December31, 2022, respectively
— —
Preferred stock, $0.0001 par value; 100 shares authorized, unissued — —
Treasury stock at cost, 237 and 173 shares as of September30, 2023 and December31,
2022, respectively
(20,513) (16,079)
Additional paid-in-capital 19,307 18,327
Retained earnings 21,798 18,954
Accumulated other comprehensive income (loss) (852) (928)
Total equity 19,740 20,274
Total liabilities and equity $ 76,440 $ 78,624

Q3 2023 Results
11
PayPal Holdings, Inc.
Unaudited Condensed Consolidated Statements of Income (Loss)
Three Months Ended September 30, Nine Months Ended September 30,
2023 2022 2023 2022
(In millions, except per share data)
Net revenues $ 7,418 $ 6,846 $ 21,745 $ 20,135
Operating expenses:
Transaction expense 3,603 2,988 10,427 8,849
Transaction and credit losses 446 367 1,286 1,184
Customer support and operations
(1)
474 509 1,454 1,579
Sales and marketing
(1)
442 544 1,343 1,733
Technology and development
(1)
739 801 2,203 2,431
General and administrative
(1)
507 463 1,505 1,584
Restructuring and other charges 39 56 227 182
Total operating expenses 6,250 5,728 18,445 17,542
Operating income 1,168 1,118 3,300 2,593
Other income (expense), net 73 460 318 (337)
Income before income taxes 1,241 1,578 3,618 2,256
Income tax expense 221 248 774 758
Net income (loss) $ 1,020 $ 1,330 $ 2,844 $ 1,498
Net income (loss) per share:
Basic $ 0.93 $ 1.15 $ 2.56 $ 1.29
Diluted $ 0.93 $ 1.15 $ 2.55 $ 1.29
Weighted average shares:
Basic 1,094 1,154 1,111 1,159
Diluted 1,098 1,157 1,115 1,163
(1)
Includes stock-based compensation as follows:
Customer support and operations $ 79 $ 56 $ 227 $ 196
Sales and marketing 44 27 132 114
Technology and development 156 115 453 380
General and administrative 115 41 315 317
$ 394 $ 239 $ 1,127 $ 1,007

Q3 2023 Results
12
PayPal Holdings, Inc.
Unaudited Condensed Consolidated Statements of Cash Flows
Three Months Ended
September 30,
Nine Months Ended
September 30,
2023 2022 2023 2022
(In millions)
Cash flows from operating activities
(1)
:
Net income (loss) $ 1,020 $ 1,330 $ 2,844 $ 1,498
Adjustments to reconcile net income (loss) to net cash provided
by operating activities:
Transaction and credit losses 446 367 1,286 1,184
Depreciation and amortization 270 330 809 991
Stock-based compensation 379 226 1,087 967
Deferred income taxes (293) (81) (439) (538)
Net (gains) losses on strategic investments (24) (495) (205) 163
Adjustments to loans and interest receivable, held for sale 15 — 49 —
Other 9 219 (267) 514
Originations of loans receivable, held for sale (4,184) — (5,705) —
Proceeds from repayments of loans receivable, originally
classified as held for sale
3,374 — 3,676 —
Changes in assets and liabilities:
Accounts receivable (71) (22) (35) (89)
Accounts payable 6 (28) (6) (55)
Income taxes payable 295 23 (31) 109
Other assets and liabilities 17 (114) (834) (522)
Net cash provided by operating activities 1,259 1,755 2,229 4,222
Cash flows from investing activities
(1)
:
Purchases of property and equipment (158) (182) (478) (548)
Proceeds from sales of property and equipment 4 — 44 5
Purchases and originations of loans receivable (4,635) (6,867) (19,802) (19,167)
Proceeds from repayments of loans receivable, originally
classified as held for investment
5,329 6,254 21,319 17,164
Purchases of investments (4,452) (3,304) (14,975) (16,455)
Maturities and sales of investments 5,368 5,683 16,110 16,770
Funds receivable (1,775) (203) (1,016) (1,085)
Collateral posted related to derivative instruments, net 19 (8) 8 (3)
Other investing activities (7) — 76 30
Net cash (used in) provided by investing activities (307) 1,373 1,286 (3,289)
Cash flows from financing activities
(1)
:
Proceeds from issuance of common stock — — 82 86
Purchases of treasury stock (1,434) (939) (4,395) (3,189)
Tax withholdings related to net share settlements of equity awards (25) (46) (225) (321)
Borrowings under financing arrangements 109 58 829 3,346
Repayments under financing arrangements — — (942) (1,686)
Funds payable and amounts due to customers 1,301 (2,245) (1,277) (659)
Collateral received related to derivative instruments, net 110 201 (65) 437
Other financing activities — — — 1
Net cash provided by (used in) financing activities 61 (2,971) (5,993) (1,985)
(1)
Reflects the impact of reclassification as described in our earnings press release dated February 9, 2023.

Q3 2023 Results
13
PayPal Holdings, Inc.
Unaudited Condensed Consolidated Statements of Cash Flows—(continued)
Three Months Ended
September 30,
Nine Months Ended
September 30,
2023 2022 2023 2022
(In millions)
Effect of exchange rate changes on cash, cash equivalents, and
restricted cash
(45) (117) (95) (253)
Net change in cash, cash equivalents, and restricted cash 968 40 (2,573) (1,305)
Cash, cash equivalents, and restricted cash at beginning of period 15,615 16,684 19,156 18,029
Cash, cash equivalents, and restricted cash at end of period $ 16,583 $ 16,724 $ 16,583 $ 16,724
Supplemental cash flow disclosures:
Cash paid for interest $ — $ 2 $ 167 $ 114
Cash paid for income taxes, net $ 152 $ 222 $ 1,058 $ 666

Q3 2023 Results
14
PayPal Holdings, Inc.
Unaudited Summary of Consolidated Net Revenues
Our revenues are classified into the following two categories:
• Transaction revenues: Net transaction fees charged to merchants and consumers on a transaction basis based on
the Total Payment Volume (“TPV”) completed on our payments platform. Growth in TPV is directly impacted by the
number of payment transactions that we enable on our payments platform. We earn additional fees from merchants
and consumers: on transactions where we perform currency conversion, when we enable cross-border transactions
(i.e., transactions where the merchant and consumer are in different countries), to facilitate the instant transfer of
funds for our customers from their PayPal or Venmo account to their bank account or debit card, to facilitate the
purchase and sale of cryptocurrencies, as contractual compensation from sellers that violate our contractual terms
(for example, through fraud or counterfeiting), and other miscellaneous fees.
• Revenues from other value added services: Net revenues derived primarily from revenue earned through
partnerships, referral fees, subscription fees, gateway fees, and other services we provide to our merchants and
consumers. We also earn revenues from interest and fees earned on our portfolio of loans receivable and interest
earned on certain assets underlying customer balances.
Net Revenues by Type
Three Months Ended
September 30,
2023
June 30,
2023
March 31,
2023
December 31,
2022
September 30,
2022
(In millions, except percentages)
Transaction revenues $ 6,654 $ 6,556 $ 6,364 $ 6,702 $ 6,234
Current quarter vs prior quarter 1 % 3 % (5) % 8 % (1) %
Current quarter vs prior year quarter 7 % 5 % 6 % 5 % 11 %
Percentage of total 90 % 90 % 90 % 91 % 91 %
Revenues from other value added services 764 731 676 681 612
Current quarter vs prior quarter 5 % 8 % (1) % 11 % 15 %
Current quarter vs prior year quarter 25 % 37 % 39 % 26 % 6 %
Percentage of total 10 % 10 % 10 % 9 % 9 %
Total net revenues $ 7,418 $ 7,287 $ 7,040 $ 7,383 $ 6,846
Current quarter vs prior quarter 2 % 4 % (5) % 8 % 1 %
Current quarter vs prior year quarter 8 % 7 % 9 % 7 % 11 %
Net Revenues by Geography
Three Months Ended
September 30,
2023
June 30,
2023
March 31,
2023
December 31,
2022
September 30,
2022
(In millions, except percentages)
U.S. net revenues $ 4,257 $ 4,210 $ 4,147 $ 4,295 $ 3,978
Current quarter vs prior quarter 1 % 2 % (3) % 8 % 3 %
Current quarter vs prior year quarter 7 % 9 % 13 % 10 % 14 %
Percentage of total 57 % 58 % 59 % 58 % 58 %
International net revenues 3,161 3,077 2,893 3,088 2,868
Current quarter vs prior quarter 3 % 6 % (6) % 8 % (3) %
Current quarter vs prior year quarter 10 % 5 % 3 % 2 % 6 %
(FXN) Current quarter vs prior year quarter 11 % 7 % 7 % 6 % 9 %
Percentage of total 43 % 42 % 41 % 42 % 42 %
Total net revenues $ 7,418 $ 7,287 $ 7,040 $ 7,383 $ 6,846
Current quarter vs prior quarter 2 % 4 % (5) % 8 % 1 %
Current quarter vs prior year quarter 8 % 7 % 9 % 7 % 11 %
(FXN) Current quarter vs prior year quarter 9 % 8 % 10 % 9 % 12 %

Q3 2023 Results
15
PayPal Holdings, Inc.
Unaudited Supplemental Operating Data
Three Months Ended
September 30,
2023
June 30,
2023
March 31,
2023
December 31,
2022
September 30,
2022
(In millions, except percentages)
Active accounts
(1)
428 431 433 435 432
Current quarter vs prior quarter (1) % (1) % — % 1 % 1 %
Current quarter vs prior year quarter (1) % — % 1 % 2 % 4 %
Number of payment transactions
(2)
6,275 6,074 5,835 6,032 5,643
Current quarter vs prior quarter 3 % 4 % (3) % 7 % 2 %
Current quarter vs prior year quarter 11 % 10 % 13 % 13 % 15 %
Payment transactions per active
account
(3)
56.6 54.7 53.1 51.4 50.1
Current quarter vs prior quarter 3 % 3 % 3 % 2 % 3 %
Current quarter vs prior year quarter 13 % 12 % 13 % 13 % 13 %
TPV
(4)
$ 387,701 $ 376,538 $ 354,508 $ 357,378 $ 336,973
Current quarter vs prior quarter 3 % 6 % (1) % 6 % (1) %
Current quarter vs prior year quarter 15 % 11 % 10 % 5 % 9 %
(FXN) Current quarter vs prior year quarter 13 % 11 % 12 % 9 % 14 %
Transaction Expense Rate
(5)
0.93 % 0.94 % 0.93 % 0.93 % 0.89 %
Transaction and Credit Loss Rate
(6)
0.12 % 0.11 % 0.12 % 0.11 % 0.11 %
Transaction Margin
(7)
45.4 % 45.9 % 47.1 % 49.7 % 51.0 %
Amounts in the table are rounded to the nearest million, except as otherwise noted. As a result, certain amounts may not
recalculate using the rounded amounts provided.
(1)
An active account is an account registered directly with PayPal or a platform access partner that has completed a
transaction on our platform, not including gateway-exclusive transactions, within the past 12 months. A platform access
partner is a third party whose customers are provided access to PayPal’s platform or services through such third-party’s
login credentials, including individuals and entities that utilize Hyperwallet’s payout capabilities. A user may register on our
platform to access different products and may register more than one account to access a product. Accordingly, a user may
have more than one active account. The number of active accounts provides management with additional perspective on
the overall scale of our platform, but may not have a direct relationship to our operating results.
(2)
Number of payment transactions are the total number of payments, net of payment reversals, successfully completed on
our payments platform or enabled by PayPal via a partner payment solution, not including gateway-exclusive transactions.
(3)
Number of payment transactions per active account reflects the total number of payment transactions within the previous
12-month period, divided by active accounts at the end of the period. The number of payment transactions per active
account provides management with insight into the average number of times an account engages in payments activity on
our payments platform in a given period. The number of times a consumer account or a merchant account transacts on our
platform may vary significantly from the average number of payment transactions per active account.
(4)
TPV is the value of payments, net of payment reversals, successfully completedon our payments platform or enabled by
PayPal via a partner payment solution, not including gateway-exclusive transactions.
(5)
Transaction expense rate is transaction expense divided by TPV.
(6)
Transaction and credit loss rate is transaction and credit losses divided by TPV.
(7)
Transaction margin is net revenues less transaction expense and transaction and credit losses, divided by net revenues.

Q3 2023 Results
16
PayPal Holdings, Inc.
Non-GAAPMeasures of Financial Performance
To supplement the company’s condensed consolidated financial statements presented in accordance with generally accepted accounting
principles, or GAAP, the company uses non-GAAP measures of certain components of financial performance. These non-GAAP measures include
non-GAAP net income, non-GAAP earnings per diluted share, non-GAAP operating income, non-GAAP operating margin, non-GAAP effective tax
rate, free cash flow, and adjusted free cash flow.
These non-GAAP measures are not in accordance with, or an alternative to, measures prepared in accordance with GAAP and may be different
from non-GAAP measures used by other companies. In addition, these non-GAAP measures are not based on any comprehensive set of
accounting rules or principles. Non-GAAP measures have limitations in that they do not reflect all of the amounts associated with the company’s
results of operations as determined in accordance with GAAP. These measures should only be used to evaluate the company’s results of
operations in conjunction with the corresponding GAAP measures.
Reconciliation of all non-GAAP measures to the most directly comparable GAAP measures can be found in the subsequent tables included in this
press release.
These non-GAAP measures are provided to enhance investors’ overall understanding of the company’s current financial performance and its
prospects for the future. Specifically, the company believes the non-GAAP measures provide useful information to both management and
investors by excluding certain expenses, gains and losses, as the case may be, that may not be indicative of its core operating results and
business outlook. In addition, because the company has historically reported certain non-GAAP results to investors, the company believes that
the inclusion of non-GAAP measures provides consistency in the company’s financial reporting.
For its internal budgeting process, and as discussed further below, the company’s management uses financial measures that do not include
stock-based compensation expense, employer payroll taxes on stock-based compensation, amortization or impairment of acquired intangible
assets, impairment of goodwill, restructuring-related charges, certain other gains, losses, benefits, or charges that are not indicative of the
company’s core operating results, and the income taxes associated with the foregoing. In addition to the corresponding GAAP measures, the
company’s management also uses the foregoing non-GAAP measures in reviewing the financial results of the company.
The company excludes the following items from non-GAAP net income, non-GAAP earnings per diluted share, non-GAAP operating income,
non-GAAP operating margin, and non-GAAP effective tax rate:
Stock-based compensation expense and related employer payroll taxes. This consists of expenses for equity awards under our equity
incentive plans. We exclude stock-based compensation expense from our non-GAAP measures primarily because they are non-cash
expenses. The related employer payroll taxes are dependent on our stock price and the timing and size of exercises and vesting of equity
awards, over which management has limited to no control, and as such management does not believe it correlates to the operation of our
business.
Amortization or impairment of acquired intangible assets, impairment of goodwill, and transaction expenses from the acquisition or
disposal of a business. We incur amortization or impairment of acquired intangible assets and goodwill in connection with acquisitions and
may incur significant gains or losses or transactional expenses from the acquisition or disposal of a business and therefore exclude these
amounts from our non-GAAP measures. We exclude these items because management does not believe they are reflective of our ongoing
operating results.
Restructuring. These consist of expenses for employee severance and other exit and disposal costs. The company excludes significant
restructuring charges primarily because management does not believe they are reflective of ongoing operating results.
Gains and losses on strategic investments. The gains and losses we record on our strategic investments are tied to the performance of the
companies that we invest in.We exclude such gains and losses in full because the operations of the investee and the related gains and
losses are not indicative of our ongoing operating results.
Certain other significant gains, losses, benefits, or charges that are not indicative of the company’s core operating results.These are
significant gains, losses, benefits, or charges during a period that are the result of isolated events or transactions which have not occurred
frequently in the past and are not expected to occur regularly in the future.The company excludes these amounts from its non-GAAP
results because management does not believe they are indicative of our current or ongoing operating results.
Tax effect of non-GAAP adjustments. This adjustment is made to present stock-based compensation and the other amounts described
above on an after-tax basis consistent with the presentation of non-GAAP net income.
Free cash flow represents operating cash flows less purchases of property and equipment. The company uses free cash flow as a liquidity
measure that provides useful information to management and investors about the amount of cash generated by the business after the purchases
of property, buildings, and equipment, which can then be used to, among other things, invest in the company’s business, make strategic
acquisitions and investments, and repurchase stock. A limitation of the utility of free cash flow as a measure of financial performance is that it
does not represent the total increase or decrease in the company’s cash balance for the period.
In addition to the non-GAAP measures discussed above, the company also analyzes certain measures, including net revenues and operating
expenses, on an FX-neutral basis to better measure the comparability of operating results between periods. The company believes that changes
in foreign currency exchange rates are not indicative of the company’s operations and evaluating growth in net revenues and operating expenses
on an FX-neutral basis provides an additional meaningful and comparable assessment of these measures to both management and investors. FX-
neutral results are calculated by translating the current period’s local currency results with the prior period’s exchange rate. FX-neutral growth
rates are calculated by comparing the current period’s FX-neutral results by the prior period’s results, excluding the impact from hedging
activities.

Q3 2023 Results
17
PayPal Holdings, Inc.
Reconciliation of GAAP Operating Income to Non-GAAP Operating Income and
GAAP Operating Margin to Non-GAAP Operating Margin
Reconciliation of GAAP Net Income (Loss) to Non-GAAP Net Income, GAAP Diluted EPS to Non-GAAP Diluted EPS, and
GAAP Effective Tax Rate to Non-GAAP Effective Tax Rate
(1)
The three months ended September 30, 2023 primarily includes $15 million in asset impairment charges for right-of-use lease assets in
conjunction with exiting certain leased space and $4 million in fees related to credit externalization. The three months ended September
30, 2022 primarily includes $29 million in asset impairment charges for right-of-use lease assets and related leasehold improvements in
conjunction with exiting certain leased space.
Three Months Ended September 30,
2023 2022
(In millions, except percentages)
(unaudited)
GAAP net revenues $ 7,418 $ 6,846
GAAP operating income 1,168 1,118
Stock-based compensation expense and related employer payroll taxes 395 239
Amortization of acquired intangible assets 58 119
Restructuring 3 23
Other
(1)
23 33
Total non-GAAP operating income adjustments 479 414
Non-GAAP operating income $ 1,647 $ 1,532
GAAP operating margin 16 % 16 %
Non-GAAP operating margin 22 % 22 %
Three Months Ended September 30,
2023 2022
(In millions, except per share data
and percentages)
(unaudited)
GAAP income before income taxes $ 1,241 $ 1,578
GAAP income tax expense 221 248
GAAP net income (loss) 1,020 1,330
Non-GAAP adjustments to net income (loss):
Non-GAAP operating income adjustments (see table above) 479 414
Net (gains) losses on strategic investments (24) (495)
Tax effect of non-GAAP adjustments (48) 5
Non-GAAP net income $ 1,427 $ 1,254
Diluted net income (loss) per share:
GAAP $ 0.93 $ 1.15
Non-GAAP $ 1.30 $ 1.08
Shares used in GAAP diluted share calculation 1,098 1,157
Shares used in non-GAAP diluted share calculation 1,098 1,157
GAAP effective tax rate 18 % 16 %
Tax effect of non-GAAP adjustments to net income (loss) (2) % — %
Non-GAAP effective tax rate 16 % 16 %

Q3 2023 Results
18
PayPal Holdings, Inc.
Reconciliation of Operating Cash Flow to Free Cash Flow and Adjusted Free Cash Flow
(1)
(1)
Reflects the impact of reclassification as described in our earnings press release dated February 9, 2023.
Three Months Ended September 30,
2023 2022
(In millions/unaudited)
Net cash provided by operating activities $ 1,259 $ 1,755
Less: Purchases of property and equipment (158) (182)
Free cash flow 1,101 1,573
Impact of net outflows for European BNPL receivables originated as HFS 810 —
Adjusted free cash flow $ 1,911 $ 1,573
